SerilogTracing 2.3.1-dev-00393
See the version list below for details.
dotnet add package SerilogTracing --version 2.3.1-dev-00393
NuGet\Install-Package SerilogTracing -Version 2.3.1-dev-00393
<PackageReference Include="SerilogTracing" Version="2.3.1-dev-00393" />
<PackageVersion Include="SerilogTracing" Version="2.3.1-dev-00393" />
<PackageReference Include="SerilogTracing" />
paket add SerilogTracing --version 2.3.1-dev-00393
#r "nuget: SerilogTracing, 2.3.1-dev-00393"
#:package SerilogTracing@2.3.1-dev-00393
#addin nuget:?package=SerilogTracing&version=2.3.1-dev-00393&prerelease
#tool nuget:?package=SerilogTracing&version=2.3.1-dev-00393&prerelease
SerilogTracing 
SerilogTracing is a minimal tracing system that integrates Serilog with .NET's System.Diagnostics.Activity. You can use it to add distributed, hierarchical tracing to applications that use Serilog, and to consume traces generated by .NET components including HttpClient and ASP.NET Core.
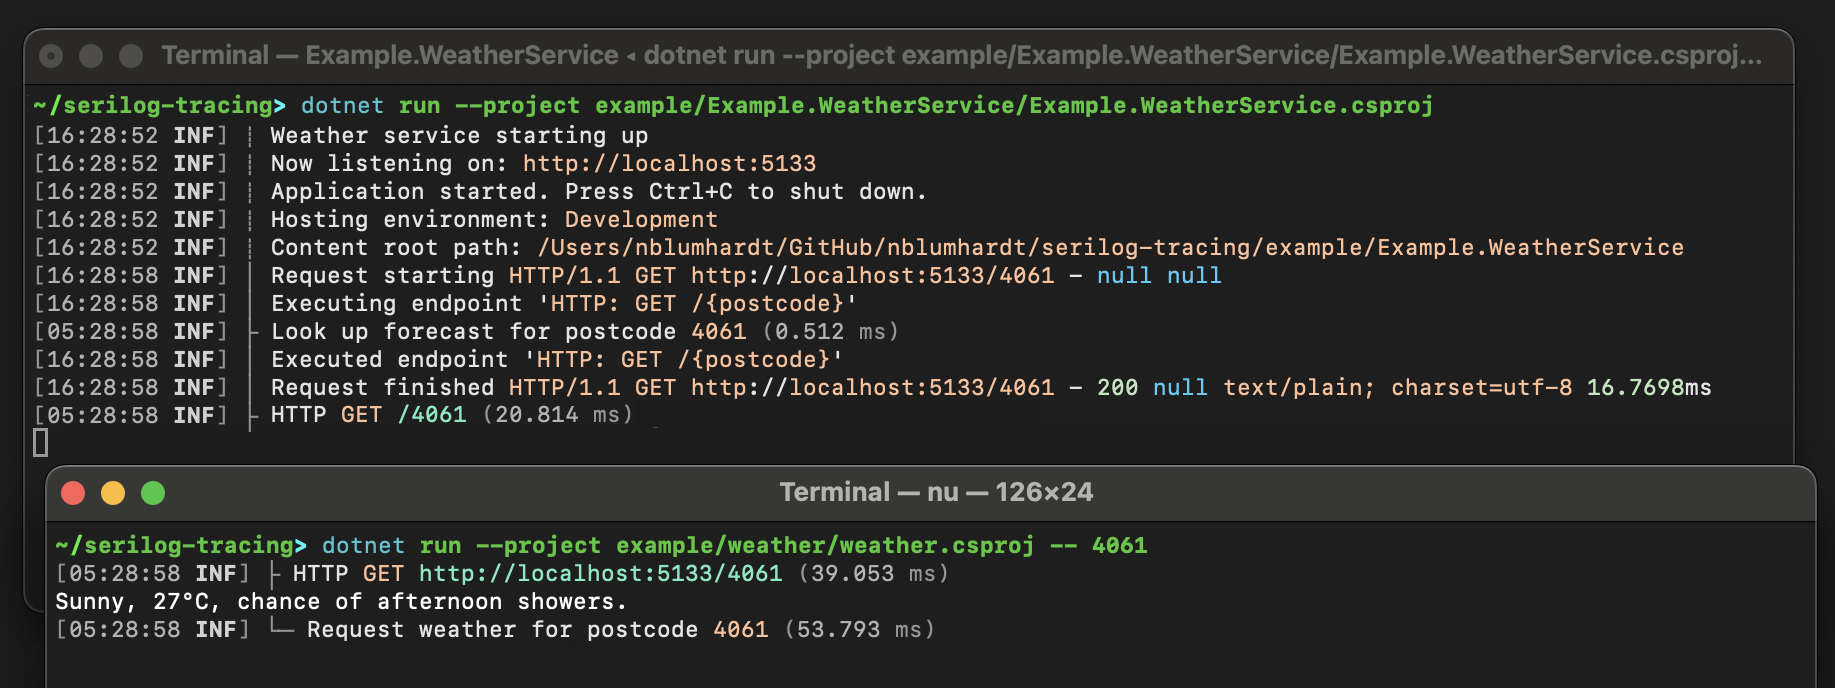
Traces are written to standard Serilog sinks. Sinks with capable back-ends support full hierarchical tracing, and others will flatten traces into individual spans with timing information.
Here's the output of the included example application in the standard System.Console sink:
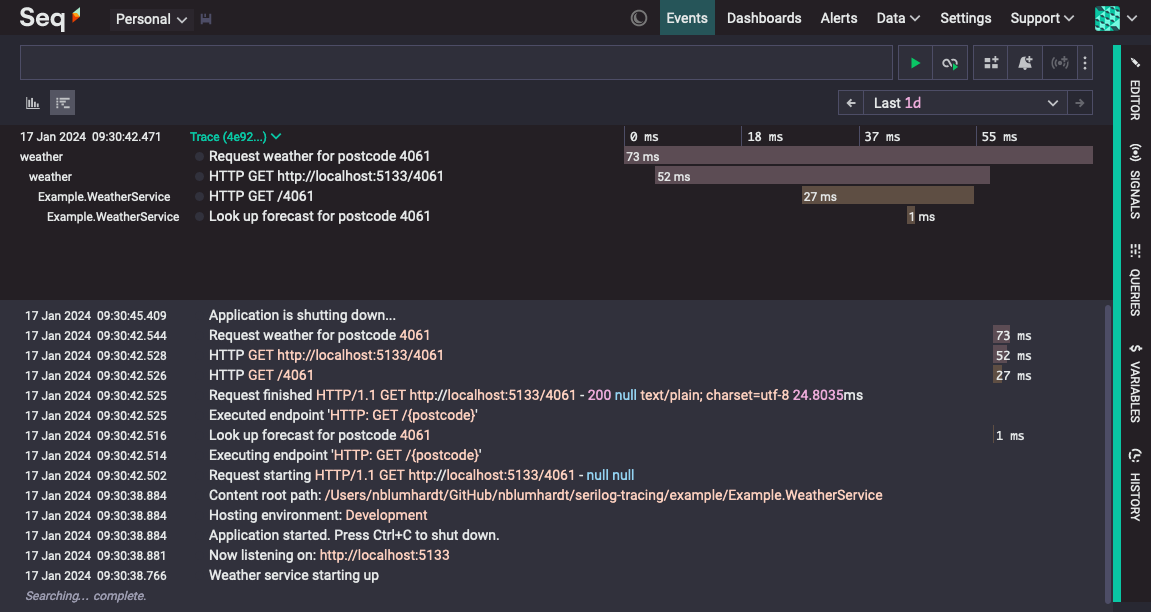
The same trace displayed in Seq:
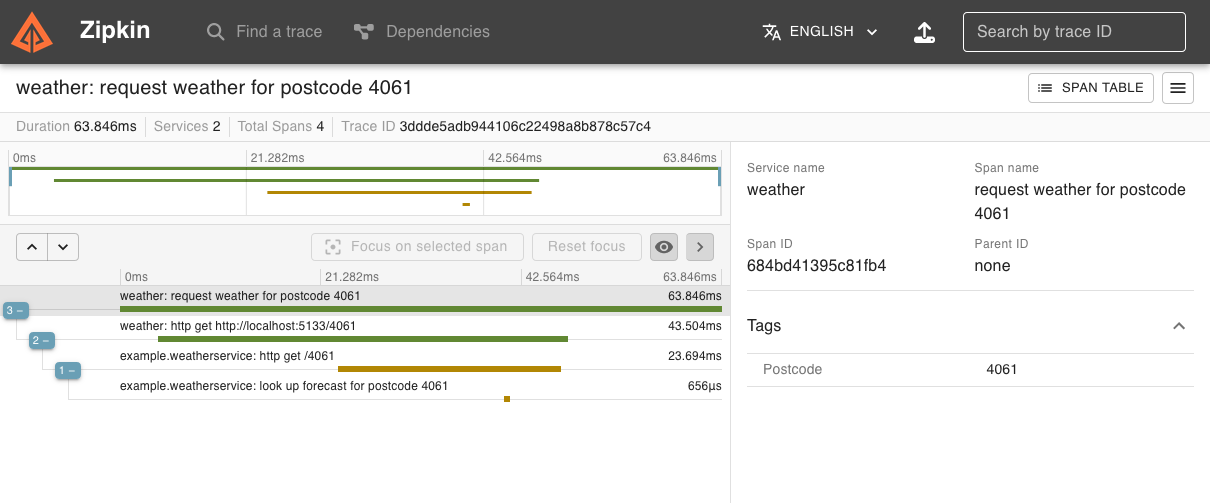
And in Zipkin:
Getting started
This section walks through a very simple SerilogTracing example. To get started we'll create a simple .NET 8 console application and install some SerilogTracing packages.
mkdir example
cd example
dotnet new console
dotnet add package SerilogTracing
dotnet add package SerilogTracing.Expressions
dotnet add package Serilog.Sinks.Console
Replace the contents of the generated Program.cs with:
using Serilog;
using Serilog.Templates.Themes;
using SerilogTracing;
using SerilogTracing.Expressions;

Log.Logger = new LoggerConfiguration()
    .WriteTo.Console(Formatters.CreateConsoleTextFormatter(TemplateTheme.Code))
    .CreateLogger();

using var listener = new ActivityListenerConfiguration().TraceToSharedLogger();

using var activity = Log.Logger.StartActivity("Check {Host}", "example.com");
try
{
    var client = new HttpClient();
    var content = await client.GetStringAsync("https://example.com");
    Log.Information("Content length is {ContentLength}", content.Length);

    activity.Complete();
}
catch (Exception ex)
{
    activity.Complete(LogEventLevel.Fatal, ex);
}
finally
{
    await Log.CloseAndFlushAsync();
}
Running it will print some log events and spans to the console:
dotnet run
Let's break the example down a bit.
Setting up the logger
The Serilog pipeline is set up normally:
using Serilog;
using Serilog.Templates.Themes;
using SerilogTracing;
using SerilogTracing.Expressions;

Log.Logger = new LoggerConfiguration()
    .WriteTo.Console(Formatters.CreateConsoleTextFormatter(TemplateTheme.Code))
    .CreateLogger();
The Formatters.CreateConsoleTextFormatter() function comes from SerilogTracing.Expressions; you can ignore this and use a regular console output template, but the one we're using here produces nice output for spans that includes timing information. Dig into the implementation of the CreateConsoleTextFormatter() function if you'd like to see how to set up your own trace-specific formatting, it's pretty straightforward.
Enabling tracing with ActivityListenerConfiguration.TraceToSharedLogger()
This line sets up SerilogTracing's integration with .NET's diagnostic sources, and starts an activity listener in the background that will write spans from the framework and third-party libraries through your Serilog pipeline:
using var listener = new ActivityListenerConfiguration().TraceToSharedLogger();
This step is optional, but you'll need this if you want to view your SerilogTracing output as hierarchical, distributed traces: without it, HttpClient won't generate spans, and won't propagate trace ids along with outbound HTTP requests.
You can also configure SerilogTracing to send spans through a specific ILogger:
using Serilog;
using SerilogTracing;
using SerilogTracing.Expressions;

await using var logger = new LoggerConfiguration()
    .WriteTo.Console(Formatters.CreateConsoleTextFormatter())
    .CreateLogger();

using var listener = new ActivityListenerConfiguration().TraceTo(logger);
Starting and completing activities
ILogger.StartActivity() is the main SerilogTracing API for starting activities. It works on any ILogger, and the span generated by the activity will be written through that logger, receiving the same enrichment and filtering as any other log event.
using var activity = Log.Logger.StartActivity("Check {Host}", "example.com");
StartActivity accepts a message template, just like Serilog, and you can capture structured properties by including them in the template.
The object returned from StartActivity() is a LoggerActivity, to which you can add additional structured data using AddProperty().
The LoggerActivity implements IDisposable, and if you let the activity be disposed normally, it will record the activity as complete, and write a span through the underlying ILogger.
In the example, because the activity needs to be completed before the Log.CloseAndFlushAsync() call at the end, we call Complete() explicitly on the success path:
try
{
    // ...
    activity.Complete();
}
catch (Exception ex)
{
    activity.Complete(LogEventLevel.Fatal, ex);
}
On the failure path, we call the overload of Complete() that accepts a level and exception, to mark the activity as failed and use the specified level for the generated log event.
Tracing-enabled sinks
These sinks have been built or modified to work well with tracing back-ends:
Serilog.Sinks.Seq- callWriteTo.Seq()to send logs and traces to Seq; useEnrich.WithProperty("Application", "your app")to show service names in traces.Serilog.Sinks.OpenTelemetry— callWriteTo.OpenTelemetry()to send traces and logs using OTLP.SerilogTracing.Sinks.Zipkin- callWriteTo.Zipkin()to send traces to Zipkin; logs are ignored by this sink.
To add tracing support to an existing sink, see how activities are mapped onto LogEvents.
Adding instrumentation for ASP.NET Core requests
If you're writing an ASP.NET Core application, you'll notice that the spans generated in response to web requests have very generic names, like HttpRequestIn. To fix that, first add SerilogTracing.Instrumentation.AspNetCore:
dotnet add package SerilogTracing.Instrumentation.AspNetCore --prerelease
Then add Instrument.AspNetCoreRequests() to your ActivityListenerConfiguration:
using var listener = new ActivityListenerConfiguration()
    .Instrument.AspNetCoreRequests()
    .TraceToSharedLogger();
Incoming traceparent headers
HTTP requests received by ASP.NET Core may contain a header with the trace id, span id, and sampling decision made for the active span in the calling application. How this header is used can be configured with HttpRequestInActivityInstrumentationOptions.IncomingTraceParent:
using var listener = new ActivityListenerConfiguration()
    .Instrument.AspNetCoreRequests(opts =>
    {
        opts.IncomingTraceParent = IncomingTraceParent.Trust;
    })
    .TraceToSharedLogger();
The supported options are:
IncomingTraceParent.Accept(default) — the parent's trace and span ids will be used, but the sampling decision will be ignored; this reveals the presence of incoming tracing information while preventing callers from controlling whether data is recordedIncomingTraceParent.Ignore— no information about the parent span will be preserved; this is the appropriate option for most public or Internet-facing sites and servicesIncomingTraceParent.Trust— use the parent's trace and span ids, and respect the parent's sampling decision; this is the appropriate option for many internal services, since it allows system-wide sampling and consistent, detailed traces
See the section Sampling below for more information on how sampling works in SerilogTracing.
Adding instrumentation for HttpClient requests
HttpClient requests are instrumented by default. To configure the way HttpClient requests are recorded as spans, remove the default instrumentation and add HttpClient instrumentation explicitly:
using var listener = new ActivityListenerConfiguration()
    .Instrument.WithDefaultInstrumentation(false)
    .Instrument.HttpClientRequests(opts => opts.MessageTemplate = "Hello, world!")
    .TraceToSharedLogger();
The message template for spans, and mappings from HttpRequestMessage and HttpResponseMessage into log event properties and the completion level can be configured.
Adding instrumentation for Microsoft.Data.SqlClient commands
Microsoft's client library for SQL Server doesn't generate spans by default. To turn on tracing of database commands, install SerilogTracing.Instrumentation.SqlClient:
dotnet add package SerilogTracing.Instrumentation.SqlClient --prerelease
Then add Instrument.SqlClientCommands() to your ActivityListenerConfiguration:
using var listener = new ActivityListenerConfiguration()
    .Instrument.SqlClientCommands()
    .TraceToSharedLogger();
Adding instrumentation for Npgsql commands
Npgsql is internally instrumented using System.Diagnostics.Activity, so no additional packages or steps are required to enable instrumentation of Npgsql commands. If you're missing spans from Npgsql, check that the "Npgsql" namespace isn't suppressed by your MinimumLevel.Override() configuration.
Formatting output
SerilogTracing includes extensions to Serilog.Expressions aimed at producing useful text and JSON output from spans:
dotnet add package SerilogTracing.Expressions --prerelease
For console output, Formatters.CreateConsoleTextFormatter() provides span timings in a pleasant ANSI-colored format:
Log.Logger = new LoggerConfiguration()
    // The `Formatters` class is from `SerilogTracing.Expressions`
    .WriteTo.Console(Formatters.CreateConsoleTextFormatter(TemplateTheme.Code))
    .CreateLogger();
Alternatively, TracingNameResolver can be used with ExpressionTemplate to create text or JSON output. The
example above expands into the (admittedly quite dense) template below:
var formatter = new ExpressionTemplate(
    "[{@t:HH:mm:ss} {@l:u3}] " +
    "{#if IsRootSpan()}\u2514\u2500 {#else if IsSpan()}\u251c {#else if @sp is not null}\u2502 {#else}\u250A {#end}" +
    "{@m}" +
    "{#if IsSpan()} ({Milliseconds(Elapsed()):0.###} ms){#end}" +
    "\n" +
    "{@x}",
    theme: TemplateTheme.Code,
    nameResolver: new TracingNameResolver());

Log.Logger = new LoggerConfiguration()
    .WriteTo.Console(formatter)
    .CreateLogger();
For an example showing how to produce JSON with ExpressionTemplate, see the implementation of ZipkinSink in this repository,
and this article introducing Serilog.Expressions JSON support.
Sampling
Sampling is a method of reducing stored data volumes by selectively recording traces. This is similar to levelling, but instead of turning individual span types on and off, sampling causes either all of the spans in a trace to be recorded, or none of them.
SerilogTracing implements two simple strategies via ActivityListenerConfiguration: Sample.AllTraces(), which records all traces (the default), and Sample.OneTraceIn(), which records a fixed proportion of possible traces:
// Record only every 1000th trace
using var listener = new ActivityListenerConfiguration()
    .Sample.OneTraceIn(1000)
    .TraceToSharedLogger();
More sophisticated sampling strategies can be plugged in through Sample.Using(). These behave like the raw System.Diagnostics.ActivityListener API, but only apply to root spans. Setting the ignoreParent method parameter to true can be used to exactly mimic the System.Diagnostics.ActivityListener behavior.
Once a sampling decision has been made for the root activity in a trace, SerilogTracing's sampling infrastructure will ensure all child activities inherit that sampling decision, regardless of the sampling policy in use. This means that when sampling decisions are communicated by a remote caller, care should be taken to either discard or trust that caller's decision. See the section Adding instrumentation for ASP.NET Core requests for information on how to do this with SerilogTracing's ASP.NET Core integration.
Sampling does not affect the recording of log events: log events written during an un-sampled trace will still be recorded, and will carry trace and span ids even though the corresponding spans will be missing.
How an Activity becomes a LogEvent
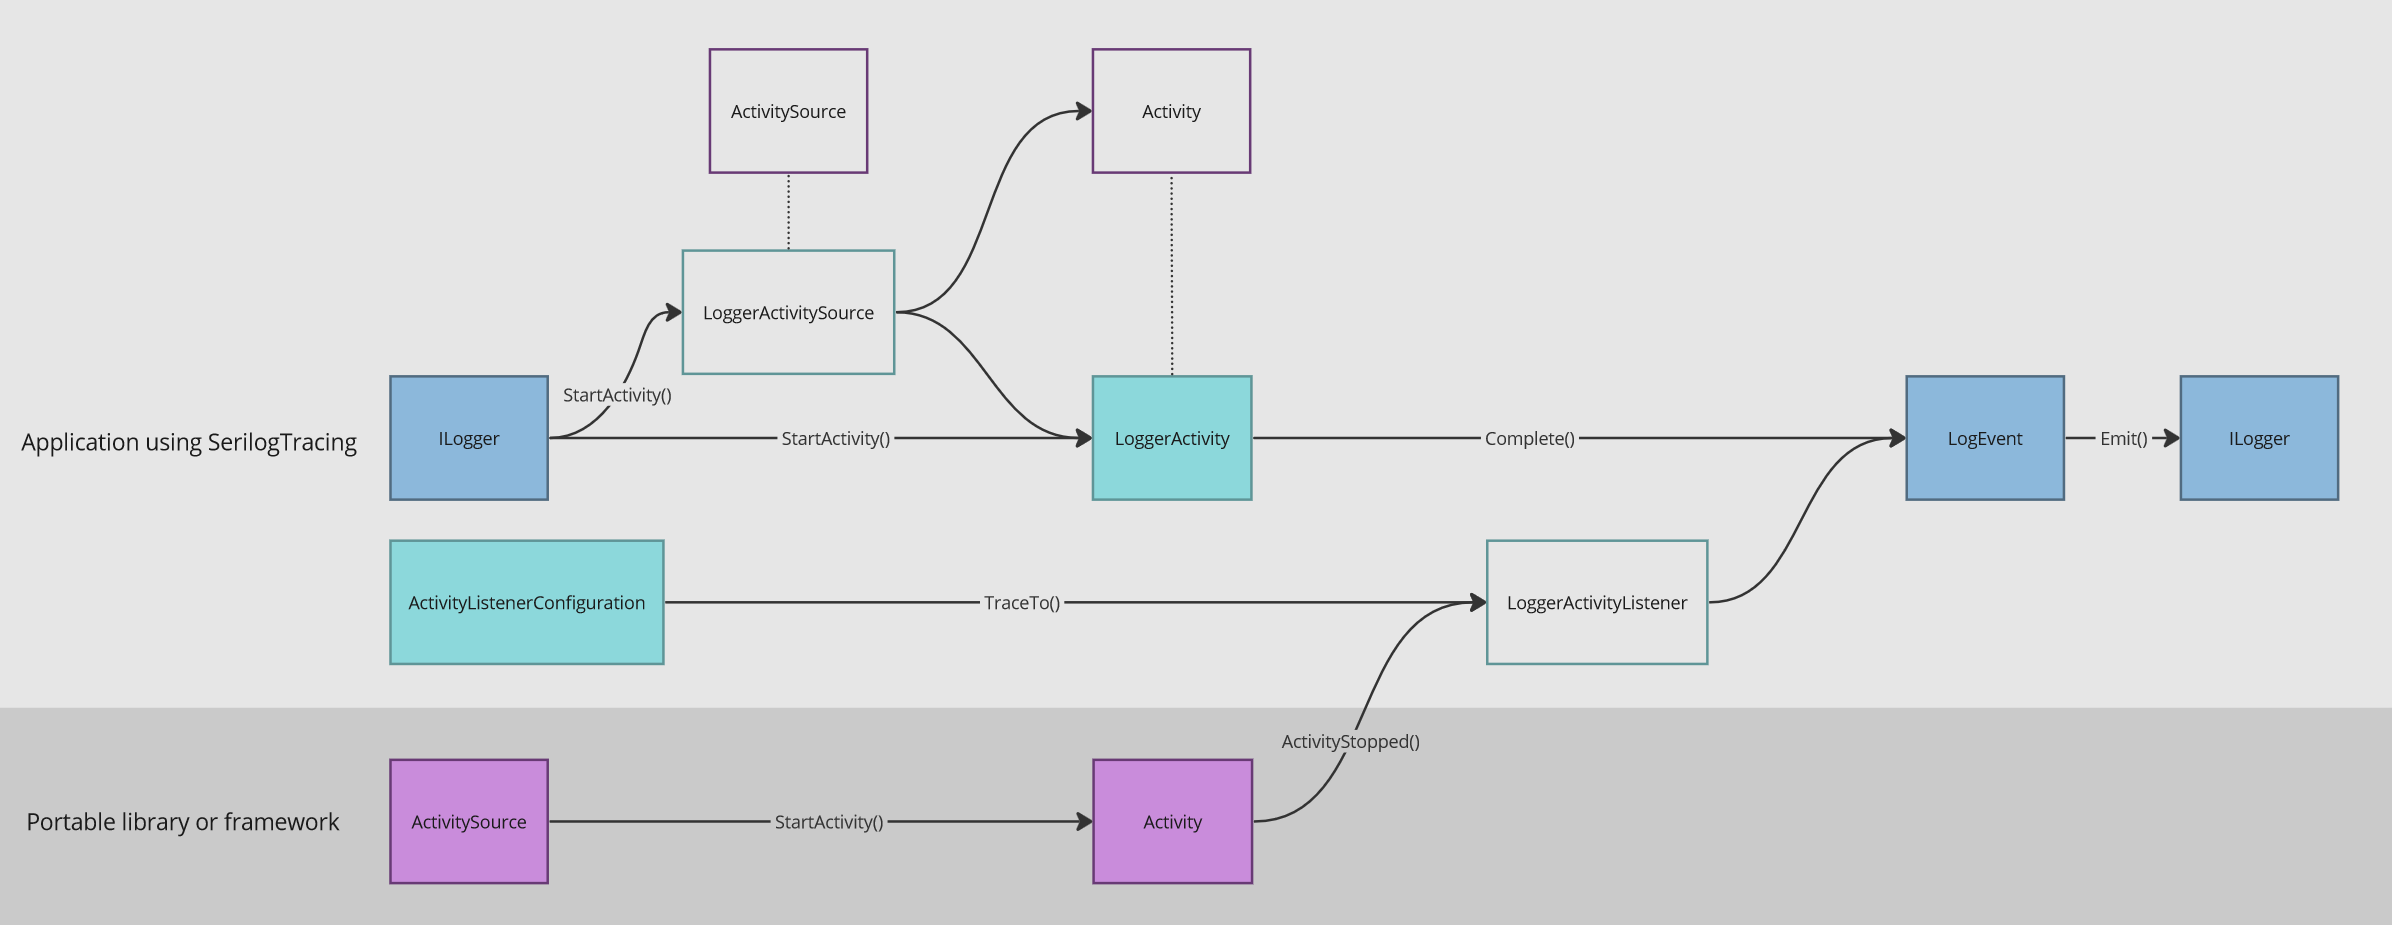
Applications using SerilogTracing add tracing using ILogger.StartActivity(). These activities are always converted into LogEvents and emitted through the original ILogger that created them.
.NET libraries and frameworks add tracing using System.Diagnostics.ActivitySources. These activities are also emitted as LogEvents when using SerilogTracing.ActivityListenerConfiguration.
Mapping trace concepts to event properties
Traces are collections of spans, connected by a common trace id. SerilogTracing maps the typical properties associated with a span onto Serilog LogEvent instances:
| Span feature | LogEvent property |
|---|---|
| Trace id | TraceId |
| Span id | SpanId |
| Parent id | Properties["ParentSpanId"] |
| Kind | Properties["SpanKind"] |
| Name | MessageTemplate |
| Start | Properties["SpanStartTimestamp"] |
| End | Timestamp |
| Status | Level |
| Status description or error event | Exception |
| Tags | Properties[*] |
Levelling for external activity sources
SerilogTracing can consume activities from .NET itself, and libraries that don't themselves use SerilogTracing. By default, you'll see spans for all activities, from all sources, in your Serilog output.
To "turn down" the level of tracing performed by an external activity source, use SerilogTracing's InitialLevel configuration to set a level for spans from that source:
.InitialLevel.Override("Npgsql", LogEventLevel.Debug)
In this example, when activities from the Npgsql activity source are assigned an initial level of Debug, they'll be suppressed unless your Serilog logger has debug logging enabled.
Why is this an initial level?
The initial level assigned to a source determines whether activities are created by the source. When the activity is completed, it may be recorded at a higher level; for example, a span created at an initial Information level may complete as an Error (but not at a lower level such as Debug, because doing so may suppress the span cause the trace hierarchy to become incoherent).
Recording Activity.Events
Activities produced by external .NET libraries may include one or more embedded ActivityEvents. By default, SerilogTracing
ignores these, except in the case of exception events, which map to the LogEvent.Exception property.
To emit additional LogEvents for each embedded ActivityEvent, call ActivityEvents.AsLogEvents() on ActivityListenerConfiguration.
What's the relationship between SerilogTracing and OpenTelemetry?
OpenTelemetry is a project that combines a variety of telemetry data models, schemas, APIs, and SDKs. SerilogTracing, like Serilog itself, has no dependency on the OpenTelemetry SDK, but can output traces using the OpenTelemetry Protocol (OTLP). From the point of view of SerilogTracing, this is considered to be just one of many protocols and systems that exist in the wider Serilog ecosystem.
If you're working in an environment with deep investment in OpenTelemetry, you might consider using the OpenTelemetry .NET SDK instead of SerilogTracing. If you're seeking lightweight, deliberate instrumentation that has the same crafted feel and tight control offered by Serilog, you're in the right place.
Who is developing SerilogTracing?
SerilogTracing is an open source (Apache 2.0) project that welcomes your ideas and contributions. It's built by @nblumhardt (also a Serilog maintainer), @liammclennan and @kodraus from Datalust, the company behind Seq.
SerilogTracing is not an official Serilog or Datalust project, but our hope for it is that it can serve as a validation and a basis for deeper tracing support in Serilog in the future.
| Product | Versions Compatible and additional computed target framework versions. |
|---|---|
| .NET | net5.0 was computed. net5.0-windows was computed. net6.0 is compatible. net6.0-android was computed. net6.0-ios was computed. net6.0-maccatalyst was computed. net6.0-macos was computed. net6.0-tvos was computed. net6.0-windows was computed. net7.0 was computed. net7.0-android was computed. net7.0-ios was computed. net7.0-maccatalyst was computed. net7.0-macos was computed. net7.0-tvos was computed. net7.0-windows was computed. net8.0 is compatible. net8.0-android was computed. net8.0-browser was computed. net8.0-ios was computed. net8.0-maccatalyst was computed. net8.0-macos was computed. net8.0-tvos was computed. net8.0-windows was computed. net9.0 was computed. net9.0-android was computed. net9.0-browser was computed. net9.0-ios was computed. net9.0-maccatalyst was computed. net9.0-macos was computed. net9.0-tvos was computed. net9.0-windows was computed. net10.0 was computed. net10.0-android was computed. net10.0-browser was computed. net10.0-ios was computed. net10.0-maccatalyst was computed. net10.0-macos was computed. net10.0-tvos was computed. net10.0-windows was computed. |
| .NET Core | netcoreapp2.0 was computed. netcoreapp2.1 was computed. netcoreapp2.2 was computed. netcoreapp3.0 was computed. netcoreapp3.1 was computed. |
| .NET Standard | netstandard2.0 is compatible. netstandard2.1 was computed. |
| .NET Framework | net461 was computed. net462 was computed. net463 was computed. net47 was computed. net471 was computed. net472 was computed. net48 was computed. net481 was computed. |
| MonoAndroid | monoandroid was computed. |
| MonoMac | monomac was computed. |
| MonoTouch | monotouch was computed. |
| Tizen | tizen40 was computed. tizen60 was computed. |
| Xamarin.iOS | xamarinios was computed. |
| Xamarin.Mac | xamarinmac was computed. |
| Xamarin.TVOS | xamarintvos was computed. |
| Xamarin.WatchOS | xamarinwatchos was computed. |
NuGet packages (8)
Showing the top 5 NuGet packages that depend on SerilogTracing:
| Package | Downloads |
|---|---|
|
SerilogTracing.Instrumentation.AspNetCore
Package Description |
|
|
SerilogTracing.Expressions
Package Description |
|
|
SerilogTracing.Instrumentation.SqlClient
Package Description |
|
|
SerilogTracing.Sinks.OpenTelemetry
Sends log events and traces to OTLP (gRPC or HTTP) endpoints. This package is obsolete; use Serilog.Sinks.OpenTelemetry v4.x or later instead. |
|
|
SerilogTracing.Sinks.Zipkin
Package Description |
GitHub repositories (1)
Showing the top 1 popular GitHub repositories that depend on SerilogTracing:
| Repository | Stars |
|---|---|
|
datalust/seqcli
The Seq command-line client. Administer, log, ingest, search, from any OS.
|
| Version | Downloads | Last Updated |
|---|---|---|
| 2.3.1 | 717,709 | 12/19/2024 |
| 2.3.1-dev-00396 | 304 | 12/19/2024 |
| 2.3.1-dev-00395 | 396 | 12/8/2024 |
| 2.3.1-dev-00393 | 288 | 12/8/2024 |
| 2.3.0 | 210,960 | 11/28/2024 |
| 2.3.0-dev-00387 | 273 | 11/28/2024 |
| 2.3.0-dev-00386 | 394 | 11/15/2024 |
| 2.3.0-dev-00384 | 287 | 11/15/2024 |
| 2.3.0-dev-00377 | 6,186 | 11/10/2024 |
| 2.3.0-dev-00376 | 309 | 11/10/2024 |
| 2.3.0-dev-00360 | 9,154 | 10/18/2024 |
| 2.2.1-dev-00359 | 282 | 10/18/2024 |
| 2.2.1-dev-00356 | 2,707 | 10/14/2024 |
| 2.2.0 | 187,288 | 10/14/2024 |
| 2.2.0-dev-00353 | 312 | 10/10/2024 |
| 2.2.0-dev-00352 | 322 | 10/10/2024 |
| 2.1.3-dev-00351 | 329 | 10/10/2024 |
| 2.1.2 | 24,841 | 10/8/2024 |
| 2.1.2-dev-00345 | 319 | 10/8/2024 |
| 2.1.2-dev-00344 | 328 | 10/8/2024 |
| 2.1.2-dev-00342 | 462 | 10/8/2024 |
| 2.1.2-dev-00339 | 314 | 10/4/2024 |
| 2.1.2-dev-00336 | 329 | 10/2/2024 |
| 2.1.1 | 122,850 | 10/2/2024 |
| 2.1.1-dev-00332 | 328 | 10/2/2024 |
| 2.1.1-dev-00331 | 295 | 10/2/2024 |
| 2.1.1-dev-00324 | 2,072 | 7/29/2024 |
| 2.1.0 | 99,517 | 7/29/2024 |
| 2.1.0-dev-00322 | 293 | 7/29/2024 |
| 2.1.0-dev-00321 | 239 | 7/29/2024 |
| 2.1.0-dev-00320 | 258 | 7/29/2024 |
| 2.1.0-dev-00319 | 290 | 7/29/2024 |
| 2.1.0-dev-00317 | 388 | 7/24/2024 |
| 2.1.0-dev-00313 | 433 | 7/22/2024 |
| 2.0.1-dev-00312 | 349 | 7/22/2024 |
| 2.0.0 | 124,992 | 6/4/2024 |
| 2.0.0-dev-00306 | 374 | 6/3/2024 |
| 2.0.0-dev-00305 | 393 | 6/3/2024 |
| 2.0.0-dev-00304 | 407 | 6/1/2024 |
| 2.0.0-dev-00303 | 418 | 6/1/2024 |
| 1.1.0 | 96,468 | 5/2/2024 |
| 1.1.0-dev-00298 | 371 | 5/24/2024 |
| 1.1.0-dev-00297 | 390 | 5/24/2024 |
| 1.1.0-dev-00296 | 396 | 5/24/2024 |
| 1.1.0-dev-00295 | 339 | 5/16/2024 |
| 1.1.0-dev-00292 | 392 | 5/10/2024 |
| 1.1.0-dev-00287 | 408 | 5/1/2024 |
| 1.1.0-dev-00286 | 403 | 5/1/2024 |
| 1.1.0-dev-00283 | 404 | 4/30/2024 |
| 1.1.0-dev-00282 | 412 | 4/30/2024 |
| 1.0.1 | 17,830 | 4/18/2024 |
| 1.0.1-dev-00280 | 402 | 4/30/2024 |
| 1.0.1-dev-00276 | 367 | 4/18/2024 |
| 1.0.1-dev-00275 | 363 | 4/18/2024 |
| 1.0.1-dev-00273 | 15,629 | 3/26/2024 |
| 1.0.1-dev-00267 | 65,551 | 3/11/2024 |
| 1.0.1-dev-00266 | 519 | 3/11/2024 |
| 1.0.1-dev-00264 | 906 | 3/10/2024 |
| 1.0.1-dev-00261 | 1,741 | 3/5/2024 |
| 1.0.0 | 36,665 | 3/3/2024 |
| 1.0.0-dev-00257 | 4,013 | 2/29/2024 |
| 1.0.0-dev-00256 | 386 | 2/29/2024 |
| 1.0.0-dev-00251 | 1,184 | 2/27/2024 |
| 1.0.0-dev-00249 | 344 | 2/26/2024 |
| 1.0.0-dev-00247 | 373 | 2/26/2024 |
| 1.0.0-dev-00246 | 404 | 2/24/2024 |
| 1.0.0-dev-00242 | 1,480 | 2/22/2024 |
| 1.0.0-dev-00240 | 392 | 2/21/2024 |
| 1.0.0-dev-00236 | 371 | 2/21/2024 |
| 1.0.0-dev-00233 | 2,095 | 2/12/2024 |
| 1.0.0-dev-00231 | 732 | 2/12/2024 |
| 1.0.0-dev-00229 | 383 | 2/12/2024 |
| 1.0.0-dev-00228 | 394 | 2/12/2024 |
| 1.0.0-dev-00227 | 395 | 2/12/2024 |
| 1.0.0-dev-00225 | 349 | 2/12/2024 |
| 1.0.0-dev-00214 | 817 | 2/10/2024 |
| 1.0.0-dev-00179 | 369 | 2/9/2024 |
| 1.0.0-dev-00167 | 335 | 2/8/2024 |
| 1.0.0-dev-00164 | 373 | 2/8/2024 |
| 1.0.0-dev-00159 | 415 | 2/8/2024 |
| 1.0.0-dev-00155 | 394 | 2/7/2024 |
| 1.0.0-dev-00150 | 390 | 2/7/2024 |
| 1.0.0-dev-00142 | 460 | 2/6/2024 |
| 1.0.0-dev-00138 | 399 | 2/6/2024 |
| 1.0.0-dev-00135 | 399 | 2/6/2024 |
| 1.0.0-dev-00134 | 381 | 2/6/2024 |
| 1.0.0-dev-00132 | 428 | 2/5/2024 |
| 1.0.0-dev-00127 | 346 | 2/5/2024 |
| 1.0.0-dev-00121 | 405 | 2/1/2024 |
| 1.0.0-dev-00118 | 349 | 2/1/2024 |
| 1.0.0-dev-00115 | 339 | 2/1/2024 |
| 1.0.0-dev-00113 | 355 | 2/1/2024 |
| 1.0.0-dev-00107 | 326 | 1/31/2024 |
| 1.0.0-dev-00103 | 368 | 1/30/2024 |
| 1.0.0-dev-00102 | 1,288 | 1/25/2024 |
| 1.0.0-dev-00100 | 543 | 1/24/2024 |
| 1.0.0-dev-00097 | 364 | 1/24/2024 |
| 1.0.0-dev-00090 | 536 | 1/24/2024 |
| 1.0.0-dev-00088 | 1,230 | 1/22/2024 |
| 1.0.0-dev-00087 | 360 | 1/19/2024 |
| 1.0.0-dev-00086 | 339 | 1/18/2024 |
| 1.0.0-dev-00082 | 292 | 1/17/2024 |
| 1.0.0-dev-00080 | 294 | 1/17/2024 |
| 1.0.0-dev-00079 | 263 | 1/17/2024 |
| 1.0.0-dev-00077 | 281 | 1/17/2024 |
| 1.0.0-dev-00076 | 288 | 1/17/2024 |
| 1.0.0-dev-00070 | 270 | 1/16/2024 |
| 1.0.0-dev-00067 | 293 | 1/16/2024 |
| 1.0.0-dev-00066 | 262 | 1/16/2024 |
| 1.0.0-dev-00055 | 367 | 1/11/2024 |
| 1.0.0-dev-00051 | 244 | 1/10/2024 |
| 1.0.0-dev-00049 | 193 | 1/9/2024 |
| 1.0.0-dev-00044 | 197 | 1/9/2024 |
| 1.0.0-dev-00039 | 240 | 1/4/2024 |
| 1.0.0-dev-00038 | 192 | 1/4/2024 |
| 1.0.0-dev-00037 | 180 | 1/3/2024 |
| 1.0.0-dev-00034 | 183 | 1/3/2024 |
| 1.0.0-dev-00031 | 169 | 1/2/2024 |
| 1.0.0-dev-00030 | 181 | 1/2/2024 |
| 1.0.0-dev-00022 | 690 | 12/4/2023 |
| 1.0.0-dev-00017 | 199 | 11/28/2023 |
| 1.0.0-dev-00016 | 242 | 11/15/2023 |
| 1.0.0-dev-00015 | 178 | 11/15/2023 |
| 1.0.0-dev-00011 | 188 | 11/10/2023 |
| 1.0.0-dev-00010 | 664 | 11/7/2023 |
| 1.0.0-dev-00009 | 170 | 11/5/2023 |